第 6 讲
期权交易策略
John C. Hull 第11章
每周提示
“牛市能赚钱,熊市能赚钱,唯有贪婪的猪会被宰割……”
— 华尔街名言 (Wall Street adage)
UTS
Lecture 6
Trading Strategies involving Options
Hull, Chapter 11
Tip of the week
“Bulls make money, bears make money, but pigs get slaughtered ...”
— Wall Street adage
UTS

学习目标

  • 构建对冲策略的损益图并探讨对冲策略:
    • 备兑看涨期权 (Covered Call)
    • 保护性看跌期权 (Protective Put)
  • 构建差价策略的损益图并探讨差价策略:
    • 牛市差价 (分别利用看涨期权和看跌期权)
    • 熊市差价 (分别利用看涨期权和看跌期权)
    • 蝶式差价 (分别利用看涨期权和看跌期权)
    • 日历差价 (Calendar spread)
  • 构建组合策略的损益图并探讨波动率交易:
    • 跨式期权 • 宽跨式期权 • 条式组合 • 带式组合
  • 纯波动率策略对比:
    • 做空波动率 vs 做多波动率

Learning Objectives

  • Construct profit/loss diagrams for hedges and discuss hedging strategies:
    • Covered Call
    • Protective Put
  • Construct profit/loss diagrams for spreads and discuss spread strategies:
    • Bull spread (using calls and puts)
    • Bear spread (using calls and puts)
    • Butterfly spread (using calls and puts)
    • Calendar spread
  • Construct profit/loss diagrams for combinations and discuss volatility trades:
    • Straddle • Strangle • Strip • Strap
  • Compare pure volatility strategies:
    • Short volatility vs Long volatility

期权与基础资产的头寸组合

  • 将期权与其基础资产进行组合:
    • 期权头寸可以与股票的多头或空头头寸相结合,从而改变投资组合的风险-收益特征。
  • 主要经典策略:
    • 备兑看涨期权 (Covered Call):
      • 为持有看涨期权空头头寸的投资者提供保护(所持基础资产覆盖了所卖出的看涨期权),并为持有基础资产的投资者提供一定的下行缓冲。
      • 在平稳或温和上涨的市场环境中获取期权费权利金收益。
    • 保护性看跌期权 (Protective Put):
      • 提供明确且有保证的短期下行保护(充当投资组合保险)。
      • 若基础资产大幅飙升,仍能完全保留无限的上方盈利潜力。

Positions in Options and Underlying Assets

  • Combining options with their underlying assets:
    • Option positions can be combined with long or short positions in the underlying stock to alter the portfolio's risk-return profile.
  • Primary Examples:
    • Covered Call:
      • Provides protection to investors with short call positions (the shares held cover the written call) and a downside buffer to investors holding the underlying asset.
      • Generates premium income in a stable or mildly bullish market.
    • Protective Put:
      • Provides guaranteed short-term downside protection (acts as portfolio insurance).
      • Preserves unlimited upside profit potential if the underlying asset rallies.

交互实验:期权策略构建器

讲到哪个策略就选哪个,看它的到期损益、最大盈亏和盈亏平衡点;也可以自己加腿搭组合。 新窗口全屏打开 ↗

Interactive Strategy Builder

Pick each strategy as it comes up and read its payoff, max profit and loss and break-evens; or build your own. Open in New Window ↗

备兑看涨期权 (Covered Call)

  • 卖出备兑看涨期权 (Writing a covered call):
    • 持有资产多头并卖出看涨期权空头:S0−c
    • 到期损益形态与卖出看跌期权同构:
      由买卖权平价定理:c+Ke−rT=p+S0
      移项可得:
      S0−c=−p+Ke−rT
  • 反向备兑看涨期权 (Reverse of writing a covered call):
    • 持有股票空头并买入看涨期权多头:−S0+c
    • 到期损益形态与买入看跌期权同构:
      −S0+c=p−Ke−rT

Covered Call

  • Writing a covered call:
    • Long position in the asset and short position in the call option: S0−c
    • Final payoff profile is isomorphic to a short put:
      From put-call parity: c+Ke−rT=p+S0
      Rearranging:
      S0−c=−p+Ke−rT
  • Reverse of writing a covered call:
    • Short position in the stock and long position in the call option: −S0+c
    • Final payoff profile is isomorphic to a long put:
      −S0+c=p−Ke−rT

案例分析 – 备兑看涨期权

本讲全部期权价格都是 Black-Scholes 价格(σ=20%,期限 1 年,r=0,不派红利)取整到美元。
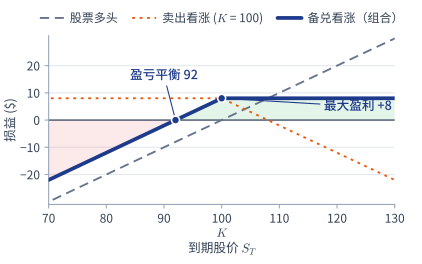
备兑看涨期权损益图
设定:以 S0=$100 买入股票,并卖出 K=$100、c=$8 的看涨期权。
净投入 S0−c=$92=−p+K(−8+100),与卖出看跌期权同形。
到期价格 ST 股票多头 看涨期权空头 (K=100) 权利金合计 净损益总计
ST<100 ST−100 0 +8 ST−92
ST≥100 ST−100 100−ST +8 +8

Example – Covered Call

All option prices in this lecture are Black-Scholes prices (σ=20%, 1 year, r=0, no dividends) rounded to whole dollars.
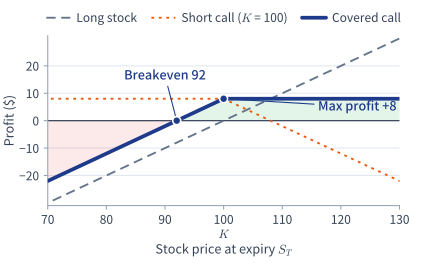
Covered call profit diagram
Setup: Buy stock for S0=$100 and short a call with K=$100, c=$8.
Net outlay S0−c=$92=−p+K (−8+100): the same shape as a short put.
Terminal Price Long Stock Short Call (K=100) Total Premium Total P/L
ST<100 ST−100 0 +8 ST−92
ST≥100 ST−100 100−ST +8 +8

备兑看涨期权:策略属性

  • 适用市场环境:市场走势平稳中性或温和看涨。
  • 策略优势:
    • 在买入股票的同时卖出看涨期权,可以降低股票的净购入成本。
    • 对已持有的股票卖出看涨期权,可带来持续的期权费权利金现金流;若股价下跌,该期权费可提供一定的下行缓冲垫。
    • 持有股票可以完全对冲股价暴涨带来的损失风险(避免了裸卖空看涨期权的无限风险)。
  • 盈亏平衡点:S0−c=$100−$8=$92。
  • 策略特性:
    • 在牛市行情中,虚值备兑看涨期权 (OTM) 具有最高的盈利潜力。
    • 在平稳行情或轻度熊市行情中,实值备兑看涨期权 (ITM) 能够提供最充裕的期权费安全垫。
  • 面临问题 / 权衡取舍:上方盈利潜力被严格封顶(上限为 K−S0+c=$8),而若股价大幅暴跌,依然面临显著的下行亏损风险(最大亏损可达 −S0+c=−$92)。

Covered Call: Strategy Properties

  • Market profile: Neutral market or mildly bullish market.
  • Benefits:
    • When buying shares, shorting call options simultaneously reduces the net purchase cost.
    • Writing calls against shares you already own generates regular premium income; the income provides downside cushion if the stock declines.
    • Owning the shares provides complete protection against large losses if the stock surges (avoids naked call risk).
  • Breakeven point: S0−c=$100−$8=$92.
  • Properties:
    • In a bullish market, OTM covered calls provide the highest profit potential.
    • In a stable/moderately bearish market, ITM covered calls provide the best premium income cushion.
  • Problem / Trade-off: Limited profit potential (capped at K−S0+c=$8) and potentially large downside loss if the stock falls severely (down to −S0+c=−$92).

保护性看跌期权 (Protective Put)

  • 保护性看跌期权:
    • 持有资产多头并买入看跌期权多头:S0+p
    • 到期损益形态与买入看涨期权同构:
      由买卖权平价定理:c+Ke−rT=p+S0
      移项可得:
      S0+p=c+Ke−rT
  • 反向保护性看跌期权:
    • 持有资产空头并卖出看跌期权空头:−S0−p
    • 到期损益形态与卖出看涨期权同构:
      −S0−p=−c−Ke−rT

Protective Put

  • Protective put:
    • Long position in the asset and long position in the put option: S0+p
    • Final payoff profile is isomorphic to a long call:
      From put-call parity: c+Ke−rT=p+S0
      Rearranging:
      S0+p=c+Ke−rT
  • Reverse protective put:
    • Short position in the asset and short position in the put option: −S0−p
    • Final payoff profile is isomorphic to a short call:
      −S0−p=−c−Ke−rT

案例分析 – 保护性看跌期权

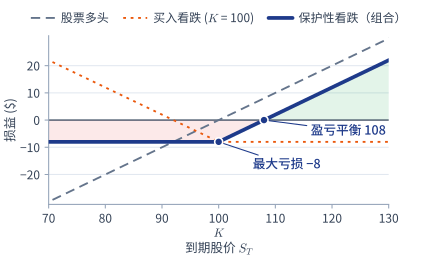
保护性看跌期权损益图
设定:以 S0=$100 买入资产,并买入行权价 K=$100、期权费 p=$8 的看跌期权(r=0,不派红利)。
期初净投入 S0+p=$108。买卖权平价:S0+p=c+K(108=8+100),与买入看涨期权同形。
到期价格 ST 股票多头 看跌期权多头 (K=100) 权利金合计 净损益总计
ST<100 ST−100 100−ST −8 −8
ST≥100 ST−100 0 −8 ST−108

Example – Protective Put

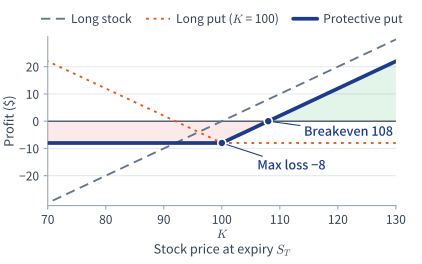
Protective put profit diagram
Setup: Buy asset for S0=$100 and a long put with K=$100 and premium p=$8 (r=0, no dividends).
Net outlay S0+p=$108. Put-call parity: S0+p=c+K (108=8+100), the same shape as a long call.
Terminal Price Long Stock Long Put (K=100) Total Premium Total P/L
ST<100 ST−100 100−ST −8 −8
ST≥100 ST−100 0 −8 ST−108

保护性看跌期权:策略属性

  • 适用市场环境:看跌的市场(对基础资产长期看涨,但对短期市场下行风险保持谨慎)。
  • 策略优势:投资组合保险 (Portfolio insurance)
    • 严格锁定最大可能亏损:下行亏损被锁定为 S0+p−K=$100+$8−$100=$8。
    • 若股票价格大幅飙升,依然享有完全无限的上方盈利空间。
  • 盈亏平衡点:S0+p=$100+$8=$108。
  • 策略特性:
    • 虚值看跌期权 (OTM) 购买成本较低,但提供的下行保护不及实值看跌期权 (ITM)。
    • 该策略在牛市中盈利:一旦股票价格上涨突破盈亏平衡线,即可实现盈利。
  • 面临问题:需要预先支付现金权利金。看跌期权费相当于保险费,在强劲牛市中会降低投资组合的整体收益率。

Protective Put: Strategy Properties

  • Market profile: Bearish market (a bullish view of the underlying, but cautious about downside market risk).
  • Benefits: Portfolio insurance
    • Provides strictly limited loss potential: downside loss is capped at S0+p−K=$100+$8−$100=$8.
    • Provides completely unlimited upside profit potential if the stock surges.
  • Breakeven point: S0+p=$100+$8=$108.
  • Properties:
    • OTM put options are cheaper to buy, but provide less downside protection than ITM put options.
    • The strategy is profitable in a bullish market: it becomes profitable once the stock price rises above the breakeven level.
  • Problem: Requires an upfront cash premium. The put premium acts as an insurance premium that reduces portfolio performance in a bull market.

备兑看涨期权 vs 保护性看跌期权:不对称风险与收益特征

核心策略差异:备兑看涨期权是一种收益增强策略 (Income-generation),通过放弃上方收益潜力换取前期的现金期权费。而保护性看跌期权则是一种资本保全策略 (Capital preservation),通过前期支付现金成本来彻底消除灾难性的尾部下行风险。

分析维度 备兑看涨期权 (S0−c) 保护性看跌期权 (S0+p)
首要目标 获取权利金收益;在盘整市场中增强回报 防范市场崩盘风险;保全资本
期初现金流 现金净流入 (+$8) 来自卖出看涨期权 现金净流出 (−$8) 用于买入看跌期权
最大利润 封顶上限:K−S0+c = $8 无限盈利:ST−108
最大亏损 下行风险:S0−c = $92 (若股价跌至 $0) 严格锁定上限:S0+p−K = $8
盈亏平衡点 下移至:S0−c = $92 上移至:S0+p = $108
合成头寸等价性 经济实质等同于卖出看跌期权 (Short Put):−p+Ke−rT = 92 经济实质等同于买入看涨期权 (Long Call):c+Ke−rT = 108
根据买卖权平价定理公式 S0−c=−p+Ke−rT,卖出备兑看涨期权的投资者所承担的经济风险剖面与单纯卖出看跌期权完全一致:有限的上方收益与几乎全部的下行暴跌风险。

Covered Call vs Protective Put: Asymmetric Risk & Profit Profiles

Strategic Distinction: The covered call is an income-generation strategy that surrenders upside for upfront cash yield. The protective put is a capital preservation strategy that pays cash upfront to eliminate catastrophic tail risk.

Dimension Covered Call (S0−c) Protective Put (S0+p)
Primary Objective Generate yield; enhance returns in stagnant market Insure against market crashes; preserve capital
Upfront Cash Flow Cash Inflow (+$8) from writing the call Cash Outflow (−$8) to buy the put
Maximum Profit Capped at: K−S0+c = $8 Unlimited: ST−108
Maximum Loss Substantial downside: S0−c = $92 (if stock goes to $0) Strictly Capped at: S0+p−K = $8
Breakeven Point Lowered to: S0−c = $92 Raised to: S0+p = $108
Synthetic Identity Behaves like a Short Put: −p+Ke−rT = 92 Behaves like a Long Call: c+Ke−rT = 108
Bionic Turtle Because put-call parity enforces S0−c=−p+Ke−rT, an investor writing a covered call assumes the exact same economic risk profile as a short put seller: limited upside and full downside exposure.

差价策略 (Spreads)

  • 定义:差价策略是指在同一种基础资产上,同时持有两种或两种以上同类型期权(即两只或多只看涨期权,或两只或多只看跌期权)的组合头寸。
  • 主要差价策略分类:
    • 牛市差价 (Bull spreads):
      • 利用看涨期权构建的牛市差价 (借方差价 Debit Spread)
      • 利用看跌期权构建的牛市差价 (贷方差价 Credit Spread)
    • 熊市差价 (Bear spreads):
      • 利用看涨期权构建的熊市差价 (贷方差价 Credit Spread)
      • 利用看跌期权构建的熊市差价 (借方差价 Debit Spread)
    • 蝶式差价 (Butterfly spreads):
      • 利用看涨期权构建的蝶式差价
      • 利用看跌期权构建的蝶式差价
    • 日历差价 (Calendar spreads):
      • 相同行权价,不同到期日

Spreads

  • Definition: A spread is a position in two or more options of the same type (i.e., two or more calls, or two or more puts) on the same underlying asset.
  • Major Types of Spreads:
    • Bull spreads:
      • Bull spread using calls (debit spread)
      • Bull spread using puts (credit spread)
    • Bear spreads:
      • Bear spread using calls (credit spread)
      • Bear spread using puts (debit spread)
    • Butterfly spreads:
      • Butterfly spread using calls
      • Butterfly spread using puts
    • Calendar spreads:
      • Same strike, different maturities

利用看涨期权的牛市差价策略

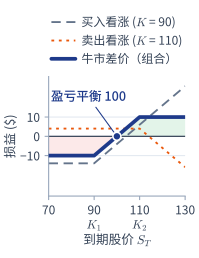
  • 头寸构成:买入较低行权价 K1 的看涨期权,同时卖出较高行权价 K2 的看涨期权 (K1<K2)。
  • 适用市场环境:温和看涨 / 高波动率(中度乐观的市场预期)。
  • 策略优势:
    • 同时锁定了最大下行风险与最大上涨盈利。
    • 期初建仓成本较低;相比直接买入看涨期权更为便宜,因为卖出高行权价看涨期权所得的权利金补贴了买入期权的支出。
  • 策略特性:
    • 买入的看涨期权 (K1) 通常处于实值 (ITM) 或平值 (ATM)(较为昂贵);整体看法是看涨。
    • 卖出的看涨期权 (K2) 通常处于虚值 (OTM)(较为便宜);它有助于为头寸融资,但会减少潜在利润。
    • 当两只看涨期权均为虚值时,构成最进取型的牛市差价策略。
  • 面临问题:建仓需要净支付现金期权费(借方差价 Debit Spread)。
看涨期权牛市差价损益图

Bull Spreads using Calls

  • Position: Long call with low strike K1 and short call with high strike K2 (K1<K2).
  • Market profile: Mildly bullish / high volatility (moderately optimistic view).
  • Benefits:
    • Limits both downside risk and upside reward.
    • Low setup cost strategy; cheaper than buying a call outright because the short call premium subsidizes the long call.
  • Properties:
    • Long call (K1) is typically ITM/ATM (expensive); the overall view is bullish.
    • Short call (K2) is typically OTM (cheaper); it helps to finance the position, but it reduces the profit potential.
    • Most aggressive bull spread occurs when both calls are OTM.
  • Problem: Requires an upfront net cash premium (debit spread).
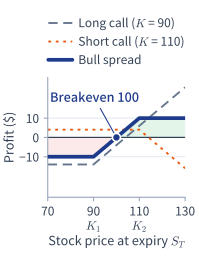
Bull Spread using Calls Diagram

利用看跌期权的牛市差价策略

  • 头寸构成:买入较低行权价 K1 的看跌期权,同时卖出较高行权价 K2 的看跌期权 (K1<K2)。
  • 短期收益增强策略:
    • 期初带来正向现金净流入(贷方差价 Credit Spread)。
    • 卖出较高行权价看跌期权收取的期权费,高于买入较低行权价看跌期权的支出 (p2>p1)。
  • 保证金要求:
    • 由于包含较高行权价的看跌期权空头,交易所会要求缴纳保证金以确保履行履约担保义务。
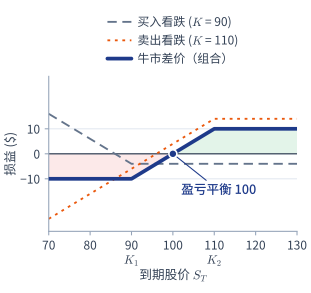
看跌期权牛市差价损益图

Bull Spreads using Puts

  • Position: Long put with low strike K1 and short put with high strike K2 (K1<K2).
  • Short-term income strategy:
    • Provides an upfront positive cash flow (credit spread).
    • Selling the higher-strike put generates more premium than the cost of buying the lower-strike put (p2>p1).
  • Margin requirements:
    • Because it involves a short put with high strike, it attracts exchange margin requirements to guarantee performance.
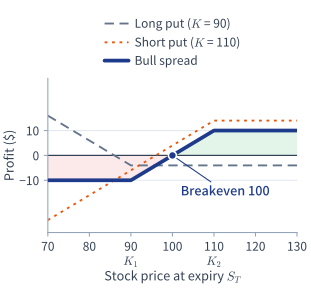
Bull Spread using Puts Diagram

牛市差价:看涨借方差价 vs 看跌贷方差价

期权市场数据 (S0=$100,r=0):看涨期权:K=90 (c=$14),K=110 (c=$4) • 看跌期权:K=90 (p=$4),K=110 (p=$14)。
差价策略类型 期权腿构成 期初净现金流 最大利润 最大亏损 盈亏平衡点 (ST)
利用看涨期权的牛市差价
(借方差价 Debit Spread)
买入看涨期权 K1=90 (−$14)
卖出看涨期权 K2=110 (+$4)
净借方支出:−$10
(现金净流出)
+$10
(110−90)−10
−$10
(期初借方支出)
90+10=$100
K1+借方成本
利用看跌期权的牛市差价
(贷方差价 Credit Spread)
买入看跌期权 K1=90 (−$4)
卖出看跌期权 K2=110 (+$14)
净贷方收入:+$10
(现金净流入)
+$10
(保留全部权利金)
−$10
(110−90)−10
110−10=$100
K2−贷方收入
  • 结构性差异:看涨期权牛市差价需要期初支付现金(无需占用保证金),而看跌期权牛市差价前期产生现金流入,但需要占用保证金以担保看跌期权空头的履约责任。
  • 箱式差价联结 (Box Spread):买入看涨牛市差价(付 $10)+ 买入看跌熊市差价(付 14−4=$10)构成了箱式差价 (Box spread),其到期回报固定为 K2−K1=$20,期初成本 10+10=$20 正是 $20 的现值(r=0,不需要折现)。若组合成本偏离这一现值,套利者将通过该无风险套利机会赚取差价。

Bull Spreads: Call Debit Spread vs Put Credit Spread

Options Data (S0=$100, r=0): Calls: K=90 (c=$14), K=110 (c=$4) • Puts: K=90 (p=$4), K=110 (p=$14).
Spread Type Option Legs Net Initial Cash Flow Max Profit Max Loss Breakeven (ST)
Bull Spread using Calls
(Debit Spread)
Long Call K1=90 (−$14)
Short Call K2=110 (+$4)
Net Debit: −$10
(Cash outflow)
+$10
(110−90)−10
−$10
(Initial debit)
90+10=$100
K1+debit
Bull Spread using Puts
(Credit Spread)
Long Put K1=90 (−$4)
Short Put K2=110 (+$14)
Net Credit: +$10
(Cash inflow)
+$10
(Keep credit)
−$10
(110−90)−10
110−10=$100
K2−credit
  • Structural Difference: Call bull spread requires paying cash upfront (no margin), whereas put bull spread yields upfront cash but requires margin to back the short put obligation.
  • Box Spread Connection: Long Call Bull Spread (pay $10) + Long Bear Put Spread (pay 14−4=$10) forms a box spread with guaranteed payoff equal to K2−K1=$20; its cost of 10+10=$20 is exactly the present value of $20 (r=0, so no discounting). If the cost differs from this present value, arbitrageurs exploit the mispricing.

利用看跌期权的熊市差价策略

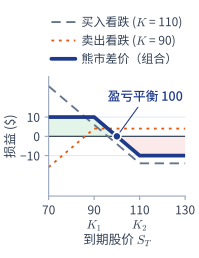
  • 头寸构成:买入较高行权价 K2 的看跌期权,同时卖出较低行权价 K1 的看跌期权 (K1<K2)。
  • 适用市场环境:温和看跌 / 高波动率(中度悲观的市场预期)。
  • 策略优势:
    • 同时锁定了最大下行收益与最大上行亏损。
    • 期初建仓成本较低;比直接买入看跌期权更便宜,因为卖出看跌期权的权利金抵消了部分买入成本。
  • 策略特性:
    • 买入的看跌期权 (K2) 通常处于实值 (ITM)(较为昂贵);整体看法是看跌。
    • 卖出的看跌期权 (K1) 通常处于虚值 (OTM)(较为便宜);它有助于为头寸融资,但会减少潜在利润。
  • 面临问题:需要期初净支付权利金(借方差价 Debit Spread)。
看跌期权熊市差价损益图

Bear Spreads using Puts

  • Position: Long put with high strike K2 and short put with low strike K1 (K1<K2).
  • Market profile: Mildly bearish / high volatility (moderately pessimistic view).
  • Benefits:
    • Limits both downside and upside risk.
    • Low setup cost strategy; cheaper than buying a put outright because short put premium offsets long put expense.
  • Properties:
    • Long put (K2) is typically ITM (expensive); the overall view is bearish.
    • Short put (K1) is typically OTM (cheaper); it helps to finance the position, but it reduces the profit potential.
  • Problem: Requires an upfront net premium (debit spread).
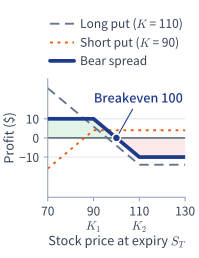
Bear Spread using Puts Diagram

利用看涨期权的熊市差价策略

  • 头寸构成:买入较高行权价 K2 的看涨期权,同时卖出较低行权价 K1 的看涨期权 (K1<K2)。
  • 短期收益增强策略:
    • 期初带来正向现金净流入(贷方差价 Credit Spread)。
    • 卖出较低行权价看涨期权 (K1) 收取的期权费,高于买入较高行权价看涨期权 (K2) 的支出。
  • 保证金要求:
    • 交易所要求缴纳保证金,以应对看涨期权空头腿在基础资产大幅上涨时可能面临的履约义务。
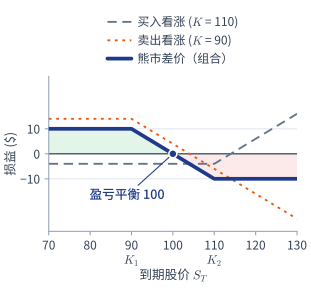
看涨期权熊市差价损益图

Bear Spreads using Calls

  • Position: Long call with high strike K2 and short call with low strike K1 (K1<K2).
  • Short-term income strategy:
    • Provides an upfront positive cash flow (credit spread).
    • Selling the lower-strike call (K1) generates more premium than the cost of buying the higher-strike call (K2).
  • Margin requirements:
    • Attracts exchange margin requirements to cover potential obligations on the short call leg.
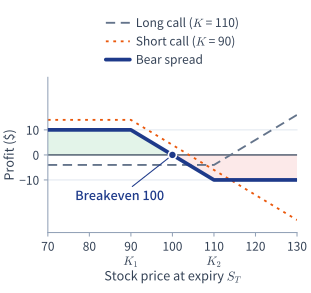
Bear Spread using Calls Diagram

利用看涨期权的蝶式差价策略

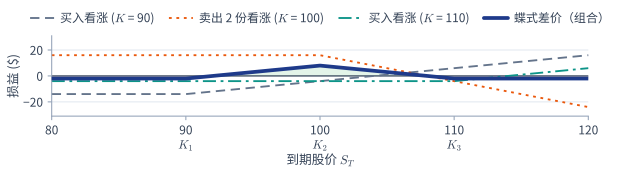
  • 构建方法:买入1份较低行权价 K1 的看涨期权,买入1份较高行权价 K3 的看涨期权,同时卖出2份中间行权价 K2 的看涨期权:
    K2=K1+K32
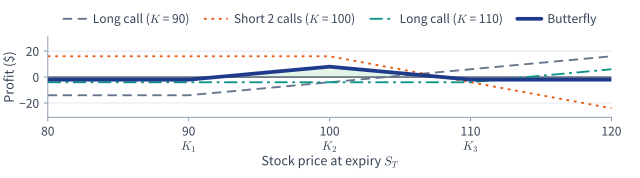
看涨期权蝶式差价损益图
  • 适用市场环境:平稳 / 低波动率预期;预计股票价格将在到期时维持在中间行权价 K2 附近。
  • 优势与局限:建仓成本低且盈利目标明确;但需要期初支付净权利金。
  • 反向蝶式差价 (Reverse Butterfly):卖出 K1、卖出 K3、买入2份 K2 → 适合预期市场将发生剧烈波动的情形。

Butterfly Spreads using Calls

  • Construction: Long one call with low strike K1, long one call with high strike K3, and short two calls with middle strike K2:
    K2=K1+K32
Butterfly Spread using Calls Diagram
  • Market profile: Stable / low volatility outlook; expects stock to remain near K2.
  • Benefits & Problem: Low setup cost with modest profit; requires upfront net premium.
  • Reverse Butterfly: Short K1, short K3, long two K2 → profitable in high volatility.

案例:利用看涨期权的蝶式差价策略

设定:投资者预期未来1年内某股票 (S0=$100) 走势平稳。市场有三只1年期看涨期权(r=0,不派红利):
K1=$90,c1=$14;K2=$100,c2=$8;K3=$110,c3=$4
(ci:行权价为 Ki 的看涨期权的权利金)
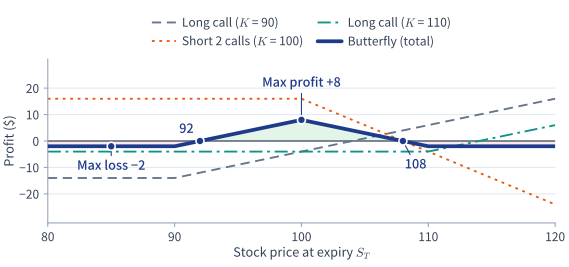
头寸构成:买入1份 Call (90),卖出2份 Call (100),买入1份 Call (110)。建仓成本:−14+2(8)−4=−$2.00。
到期价格 ST 买入看涨 (90) 卖出2份看涨 (100) 买入看涨 (110) 权利金合计 净损益总计
ST<90 0 0 0 -2 −2
90≤ST<100 ST−90 0 0 -2 ST−92
100≤ST<110 ST−90 2(100−ST) 0 -2 108−ST
ST≥110 ST−90 2(100−ST) ST−110 -2 −2

Example: Butterfly Spread using Calls

Setup: Investor expects a stable market over the next year on a stock (S0=$100). Three 1-year calls are available (r=0, no dividends):
K1=$90,c1=$14 • K2=$100,c2=$8 • K3=$110,c3=$4 (where c1,c2,c3 are the premiums of the calls with strikes K1,K2,K3)
Position: Long 1 Call (90), Short 2 Calls (100), Long 1 Call (110). Setup cost: −14+2(8)−4=−$2.00.
Terminal Price Long Call (90) Short 2 Calls (100) Long Call (110) Total Premium Total P/L
ST<90 0 0 0 -2 −2
90≤ST<100 ST−90 0 0 -2 ST−92
100≤ST<110 ST−90 2(100−ST) 0 -2 108−ST
ST≥110 ST−90 2(100−ST) ST−110 -2 −2

案例分析 – 蝶式差价策略评估

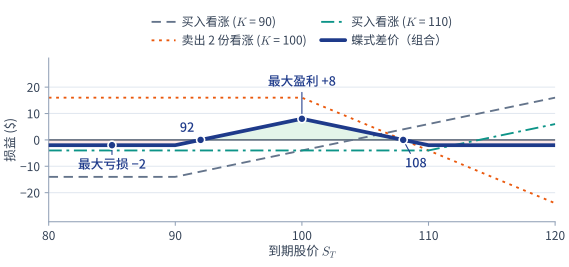
蝶式差价损益图:最大盈利 +8 在 100
  • 盈亏平衡点:ST=$92 与 ST=$108。
  • 最大利润:当 ST=$100(中间行权价)时取得最大利润 +$8.00。
  • 最大亏损:当 ST≤90 或 ST≥110 时,亏损锁定为期初净权利金支出 −$2.00。
  • 盈利价格区间:当 $92<ST<$108 时该策略实现净盈利。
  • 利用看跌期权的蝶式差价:买入看跌 K1、卖出2份看跌 K2、买入看跌 K3 会产生完全一致的损益图。

Example – Butterfly Spread Analysis

Butterfly Spread Profit Diagram with Peak of +$8 at $100
  • Breakeven points: ST=$92 and ST=$108.
  • Maximum profit: +$8.00 when ST=$100 (the middle strike price).
  • Maximum loss: Capped at −$2.00 (the initial net premium) when ST≤90 or ST≥110.
  • Profitable range: Strategy is profitable when $92<ST<$108.
  • Butterfly Spreads using Puts: Long put K1, short two puts K2, long put K3 yields identical payoffs.

日历差价策略 (Calendar Spread)

  • 核心概念:利用相同行权价 K 但不同到期日的期权构建组合。
  • 利用看涨期权的日历差价:
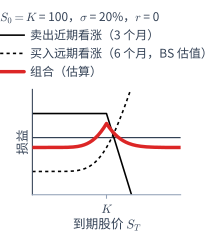
    • 卖出近期看涨期权,同时买入远期看涨期权。
    • 利用了近期期权时间价值衰减速度快于远期期权(近期期权具有更高的 Θ 绝对值,Θ:期权价值随时间流逝而发生的变化,即时间衰减)的特性。
    • 若在近期期权到期时,股票价格接近行权价 K,近期期权将毫无价值地作废,而远期期权依然保留着可观的时间价值。
  • 利用看跌期权的日历差价:
    • 卖出近期看跌期权,同时买入远期看跌期权。
  • 反向日历差价 (Reverse Calendar Spread):
    • 买入近期期权并卖出远期期权;当股票价格发生剧烈单向大幅突破时获利。
日历差价策略损益示意图

Calendar Spread

  • Core Concept: Use options with the same strike price K but different expiration dates.
  • Calendar spread using Calls:
    • Sell a short-dated call option and buy a longer-dated call option.
    • Capitalizes on the fact that the short-dated option decays faster (higher Θ in absolute value; Θ is theta, the change in option value as time passes) than the long-dated option.
    • If the stock price remains close to strike K when the short option expires, the short option expires worthless while the long-dated option retains substantial time value.
  • Calendar spread using Puts:
    • Sell a short-dated put option and buy a longer-dated put option.
  • Reverse Calendar Spread:
    • Buy a short-dated option and sell a longer-dated option; profitable when stock makes large directional moves.
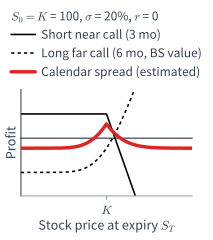
Calendar Spread Payoff Diagram (estimated)

组合策略 (Combinations)

  • 定义:组合策略是指将同一种基础资产上的看涨期权与看跌期权混合构建的交易策略。
  • 主要类别:
    • 跨式期权 (Straddles):相同的行权价与相同的到期日。
    • 条式与带式组合 (Strips and Straps):看涨期权与看跌期权比例不对称的组合。
    • 宽跨式期权 (Strangles):不同的行权价与相同的到期日。
  • 组合策略的本质 – 纯波动率交易:
    • 做多波动率策略 (Long volatility):当基础资产在任一方向出现大幅价格跳跃变动时盈利(具有正的 Vega 值,Vega:期权价值对波动率的敏感度)。
    • 做空波动率策略 (Short volatility):当基础资产价格平稳盘整、窄幅震荡时盈利(具有正的 Theta 值,即前述时间衰减;赚取时间价值衰减)。

Combinations

  • Definition: Combinations are trading strategies that involve mixtures of calls and puts on the same underlying asset.
  • Primary Categories:
    • Straddles: Same strike and same maturity.
    • Strips and Straps: Asymmetric combinations of calls and puts.
    • Strangles: Different strikes and same maturity.
  • Nature of Combinations – Pure Volatility Trades:
    • Long volatility strategies: Profit when the underlying asset experiences large price swings in either direction (positive Vega, i.e. option value is sensitive to volatility).
    • Short volatility strategies: Profit when the underlying asset remains quiet and range-bound (positive Theta, the time decay defined earlier; earning time decay).

跨式期权 (Straddles)

  • 底部跨式 / 买入跨式 (Bottom Straddle / Long Straddle):
    • 买入1份看涨期权和1份看跌期权,两者具有相同行权价 K 与相同到期日 T。
    • 做多波动率策略:若价格向任意方向发生大幅跳跃,即可享受无限盈利潜力。
    • 最大可能亏损严格锁定为所支付的全部权利金合计 (c+p)。
  • 顶部跨式 / 卖出跨式 (Top Straddle / Short Straddle):
    • 卖出1份看涨期权和1份看跌期权,两者具有相同的行权价 K 与到期日 T。
    • 做空波动率策略:在低波动率、波澜不惊的市场中赚取期权权利金收入。
    • 风险极高:若股价向任一方向发生剧烈波动,都将面临无限亏损的敞口。
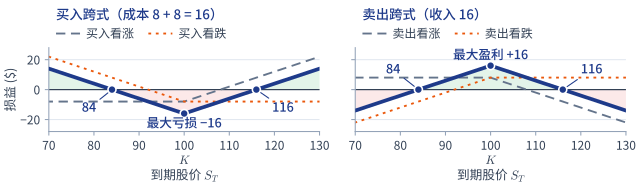
买入与卖出跨式损益图

Straddles

  • Bottom Straddle (Straddle Purchase / Long Straddle):
    • Buy 1 call and 1 put with the same strike K and same maturity T.
    • Long Volatility strategy: Unlimited profit potential if a major price jump occurs in either direction.
    • Limited maximum loss capped at total premium paid (c+p).
  • Top Straddle (Straddle Write / Short Straddle):
    • Sell 1 call and 1 put with the same strike K and maturity T.
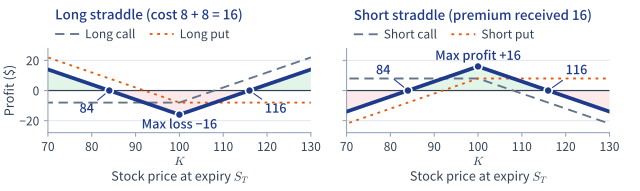
    • Short Volatility strategy: Earn premium income in low volatility, stagnant markets.
    • Highly risky: Unlimited loss potential from large price movements in either direction.
Straddle Payoff Diagram

买入 vs 卖出跨式期权:波动率机制与双重盈亏平衡点

CME 权威定义:“脚踏两只船 (Straddling the fence)” — 同时押注双向。当交易者预期价格即将发生颠覆性突破但无法确定具体突破方向时(例如在财报公布前、重大监管审批揭晓或 CPI 通胀数据发布前),买入跨式期权是标准操作。

买入跨式期权 (买入看涨 + 买入看跌)
  • 总成本:V0=c+p(最大亏损发生在 ST=K 时)。
  • 上方盈亏平衡点:K+(c+p)
  • 下方盈亏平衡点:K−(c+p)
  • 希腊字母特征:显著的正 Vega (V>0:对波动率的敏感度) 与正 Gamma (Γ>0:Delta 随股价变化的速度);承受负 Theta (Θ<0) 时间价值侵蚀。
卖出跨式期权 (卖出看涨 + 卖出看跌)
  • 最大利润:c+p(在市场收盘恰好等于行权价 K 时获得)。
  • 盈亏平衡点:完全相同(K±(c+p))。
  • 风险特征:若股价向任意一侧发生大幅跳跃并穿透平衡点,亏损潜力无限。
  • 希腊字母特征:正 Theta (Θ>0,赚取时间价值衰减) 与负 Vega (V<0)。
简单例子:K=$100,看涨、看跌期权费各 $8,总成本 c+p=$16。盈亏平衡点:100+16=$116 与 100−16=$84 —— 股价涨破 $116 或跌破 $84 才开始盈利;股价恰好收在 $100 时亏掉全部 $16。

Long vs Short Straddles: Volatility Mechanics & Dual Breakevens

CME Definition: “Straddling the fence” — betting on both sides at once. A long straddle is the standard trade when a big breakout is expected but the direction is unknown (e.g. before earnings, regulatory approvals, or CPI data).

Long Straddle (Buy Call + Buy Put)
  • Total Cost: V0=c+p (max loss at ST=K).
  • Upper Breakeven: K+(c+p)
  • Lower Breakeven: K−(c+p)
  • Greeks: Large positive Vega (V>0) and Gamma (Γ>0); negative Theta (Θ<0) time decay.
Short Straddle (Sell Call + Sell Put)
  • Max Profit: c+p (if the market closes exactly at K).
  • Breakevens: Identical (K±(c+p)).
  • Risk Profile: Unlimited loss if the stock jumps through either breakeven.
  • Greeks: Positive Theta (Θ>0, earns decay), negative Vega (V<0).
Simple Example: K=$100, call and put $8 each, so c+p=$16. Breakevens: 100+16=$116 and 100−16=$84 — profit starts only above $116 or below $84; at exactly $100 the full $16 is lost.

条式组合与带式组合 (Strips and Straps)

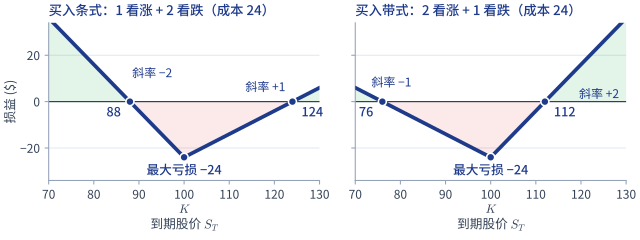
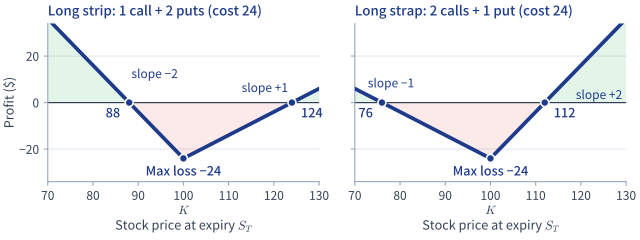
买入条式与带式损益图
  • 买入条式组合 (Long Strip):
    • 买入1份看涨期权和2份看跌期权,均具有相同的行权价 K 与到期日 T。
    • 适用市场预期:预期波动率剧烈增大,且带有偏空头倾向(下行斜率的陡峭程度是上行斜率的两倍)。
  • 买入带式组合 (Long Strap):
    • 买入2份看涨期权和1份看跌期权,均具有相同的行权价 K 与到期日 T。
    • 适用市场预期:预期波动率剧烈增大,且带有偏多头倾向(上行斜率的陡峭程度是下行斜率的两倍)。

Strips and Straps

Long Strip and Long Strap Payoff Diagrams
  • Long Strip:
    • Buy 1 call and 2 puts with the same strike K and maturity T.
    • Market profile: High volatility expected, with a bearish bias (downside slope is twice as steep as upside).
  • Long Strap:
    • Buy 2 calls and 1 put with the same strike K and maturity T.
    • Market profile: High volatility expected, with a bullish bias (upside slope is twice as steep as downside).

宽跨式期权 (Strangles)

  • 底部垂直组合 / 买入宽跨式 (Bottom Vertical Combination / Long Strangle):
    • 买入相同到期日但不同行权价的看涨期权与看跌期权:买入较低行权价 K1 的看跌期权,并买入较高行权价 K2 的看涨期权 (K1<K2)。
    • 即:买入高行权价看涨期权与低行权价看跌期权,或者买入低行权价看涨期权与高行权价看跌期权。二者有什么区别?
    • 做多波动率策略:建仓成本比跨式期权更便宜,因为两只期权通常均为虚值期权 (OTM)。
    • 权衡取舍:股价必须发生比跨式期权更大幅度的偏离波动,策略方能开始实现盈利。
  • 顶部垂直组合 / 卖出宽跨式 (Top Vertical Combination / Short Strangle):
    • 卖出不同行权价 (K1<K2) 且相同到期日的看涨期权与看跌期权。
    • 做空波动率策略;在 K1 与 K2 之间提供了一个更宽阔的安全无损盈利带。
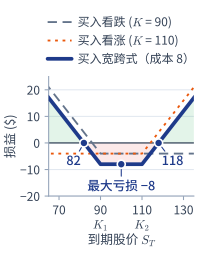
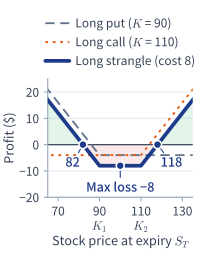
买入宽跨式损益图

Strangles

  • Bottom Vertical Combination (Strangle Purchase / Long Strangle):
    • Long a call and a put with different strikes and the same maturity: Long put with low strike K1 and long call with high strike K2 (K1<K2).
    • That is: long call with high strike and long put with low strike, or long call with low strike and long put with high strike. What is the difference?
    • Long volatility strategy: Cheaper to buy than a straddle because both options are typically OTM.
    • Trade-off: The stock price must move further than in a straddle to generate profits.
  • Top Vertical Combination (Strangle Write / Short Strangle):
    • Short a call and a put with different strikes (K1<K2) and same maturity.
    • Short volatility strategy; provides a wider safety band between K1 and K2.
Strangle Payoff Diagram

买入宽跨式:分段损益表与双重盈亏平衡点

简单例子:股票 S0=$100。买入虚值看跌期权 K1=$90 (p=$4) + 买入虚值看涨期权 K2=$110 (c=$4)。
期初总成本(最大亏损):4+4=$8。
到期价格 (ST) 到期总回报 期权费成本 净损益 策略表现 / 盈亏平衡
ST≤90 (大跌) 90−ST −$8 82−ST 盈亏平衡点:ST=$82
90<ST<110 (盘整) 0 −$8 −$8 (最大亏损) 两只期权均无价值归零作废
ST≥110 (大涨) ST−110 −$8 ST−118 盈亏平衡点:ST=$118
双重盈亏平衡点分析:
下方平衡点:90−8=$82(股价需跌超 18%)
上方平衡点:110+8=$118(股价需涨超 18%)

与平值跨式期权 (K=100) 对比:跨式组合总成本为 8+8=$16,盈亏平衡点为 $84 与 $116(股价只需波动 16%)。宽跨式便宜一半($8 vs $16),但需要股价波动超过 18% 才能扭亏为盈。课本原题(ETQ 11)完整解答见《Hull 习题与解答》第 6 讲。

Long Strangle: Piecewise Profit Table & Dual Breakevens

Simple Example: Stock S0=$100. Buy an OTM put K1=$90 (p=$4) + buy an OTM call K2=$110 (c=$4).
Total Upfront Cost (Maximum Loss): 4+4=$8.
Terminal Price (ST) Total Payoff Premium Cost Net P/L Outcome / Breakeven
ST≤90 (Plunge) 90−ST −$8 82−ST Breakeven at ST=$82
90<ST<110 (Flat) 0 −$8 −$8 (Max Loss) Both options expire worthless
ST≥110 (Surge) ST−110 −$8 ST−118 Breakeven at ST=$118
Dual Breakeven Analysis:
Lower Breakeven: 90−8=$82 (stock must fall more than 18%)
Upper Breakeven: 110+8=$118 (stock must rise more than 18%)

Comparison with the ATM straddle (K=100): The straddle costs 8+8=$16 in total, with breakevens at $84 and $116 (the stock only needs to move 16%). The strangle is half the price ($8 vs $16), but needs a move of more than 18% to turn profitable. Original Hull problem (ETQ 11) with full solution: see Hull Exercises & Solutions, Lecture 6.

做空波动率策略对比

跨式、宽跨式、蝶式差价与鹰式差价
做空波动率策略对比:跨式、蝶式、宽跨式、鹰式

Comparison of Short Volatility Strategies
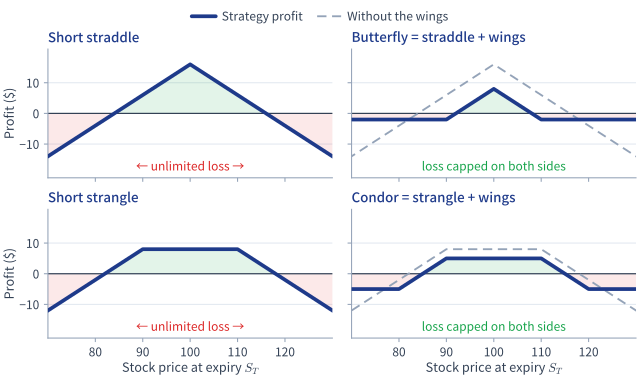
Straddle, Strangle, Butterfly, and Condor
Comparison of Short Volatility Strategies Diagram

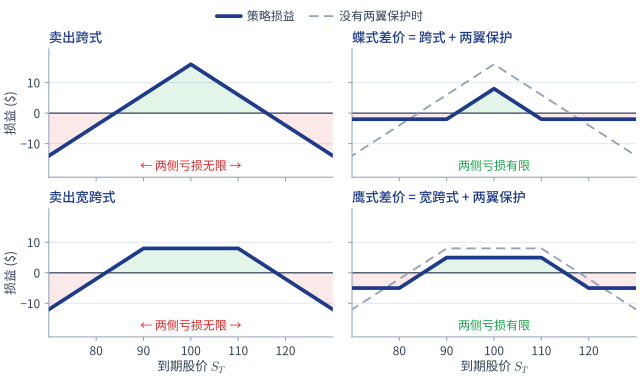
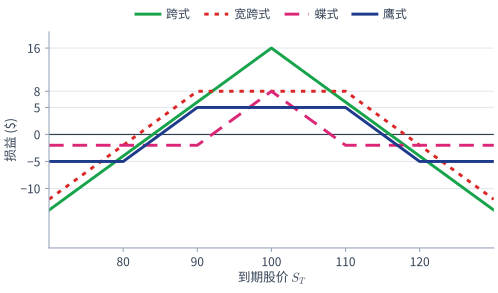
做空波动率策略:四种组合叠加在同一张图上

做空波动率策略对比:跨式、宽跨式、蝶式、鹰式叠加图
期权费 (S0=$100,r=0):卖出跨式收 $16;卖出宽跨式收 $8;蝶式 (90/100/110) 付 $2;鹰式 (80/90/110/120) 付 $5。
  • 跨式:在 $100 处利润见顶 (+16),两侧亏损无限。
  • 宽跨式:在 $90 与 $110 之间为扁平的最大收益 (+8),两侧亏损无限。
  • 蝶式:尖峰收益 (+8) 低于跨式,亏损封顶 (−2);鹰式:扁平收益且最小 (+5),亏损封顶 (−5)。

Short Volatility Strategies Overlaid on One Chart
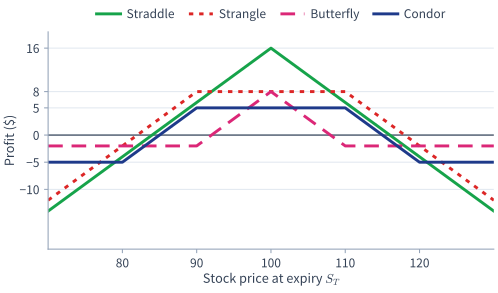
Comparison of short volatility strategies overlay: straddle, strangle, butterfly, condor
Premiums (S0=$100, r=0): short straddle receives $16; short strangle $8; butterfly (90/100/110) costs $2; condor (80/90/110/120) costs $5.
  • Straddle: profit peaks at $100 (+16), unlimited loss on both sides.
  • Strangle: flat maximum return (+8) between $90 and $110, unlimited loss on both sides.
  • Butterfly: peak (+8) below the straddle's, loss capped (−2); Condor: flat, smallest (+5), loss capped (−5).

做空波动率策略对比

  • 跨式期权 (Straddle):提供最高潜在回报,利润在股价恰好收在两只期权的行权价时见顶(本例为 $100),但在两侧均承担无限亏损风险。
  • 宽跨式期权 (Strangle):在 $90 与 $110 之间提供扁平的最大回报区间,但两侧同样面临无限亏损风险。
  • 蝶式差价 (Butterfly):具有类似跨式期权的尖峰回报形态;然而,由于买入了外侧虚值“翅膀”期权以锁定最大亏损,其最大利润有所削减。蝶式差价本质上是对跨式期权进行了风险管理的改良版本。
  • 鹰式差价 (Condor):呈现两侧风险被严格锁定的扁平最大收益区;其最大利润在四者中最小。鹰式差价本质上是对宽跨式期权进行了风险管理的改良版本。
  • 资金实力与风险管理:
    • 蝶式差价对于资金规模较小、无法承受裸卖空跨式或宽跨式无限尾部风险的交易者而言,是非常卓越的交易策略。
    • 裸卖空跨式与宽跨式期权仅适合具备雄厚资本实力、能够从容承受剧烈不利波动的专业机构投资者。

Comparison of Short Volatility Strategies

  • Straddle: Highest potential return, profit peaking at the strike price of both options, in this case $100, but unlimited loss risk on both sides.
  • Strangle: Flat maximum return between $90 and $110, but likewise unlimited loss risk on both sides.
  • Butterfly: Peaked return like the straddle, but maximum profit is reduced by buying OTM “wings” to cap the loss. Essentially a risk-managed modification of the straddle.
  • Condor: Flat maximum-return zone with strictly capped risk on both sides; smallest maximum profit of the four. Essentially a risk-managed modification of the strangle.
  • Capital Strength & Risk Management:
    • The butterfly is an excellent strategy for under-capitalized traders who cannot bear the unlimited tail risk of naked straddles or strangles.
    • Naked straddles and strangles suit only well-capitalized professionals able to withstand sharp adverse moves.